Using JMX, Groovy, Swing and JFreeChart, I came up with a dashboard application which looks like this.
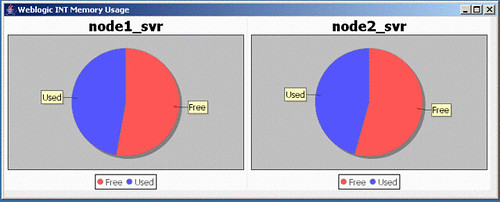
It show memory usage on two instances. It automatically updates every 10 seconds and redraws chart.
Surprisingly (or not so surprisingly), code required to be written to perform this activity is minimal. Specifically thanks to Groovy's SwingBuilder and JMX libraries. Groovy makes the task of using 4 different technologies really easy and fun.
For purpose of this blog and keeping it simple, I kept it all in one groovy class.
import org.jfree.chart.ChartFactory
import javax.swing.WindowConstants as WC
import javax.management.remote.*
import javax.naming.Context;

/**
 * WeblogicJMXReporter monitors Memory value for given node
 * @author kartik.shah
 */
public class WeblogicJMXReporter
{

    static void main(String[] args)
    {
    	def env = [:]
    	env["java.naming.factory.initial"] = "weblogic.jndi.WLInitialContextFactory"
    	env[Context.SECURITY_PRINCIPAL] = "system"
    	env[Context.SECURITY_CREDENTIALS] = "*******" //Password is always stars
    	env[JMXConnectorFactory.PROTOCOL_PROVIDER_PACKAGES] = "weblogic.management.remote"
    	def jmxServiceURL = new JMXServiceURL("http", "10.50.120.110", 19400,"/jndi/weblogic.management.mbeanservers.domainruntime")
    	def server = JMXConnectorFactory.connect(jmxServiceURL, env).MBeanServerConnection

    	def chart1Map = getChart("node1_svr", server);
    	def piedata1 = chart1Map."pieData"
    	def chart1 = chart1Map."Chart"
    	def jvmInfo1 = chart1Map."MBean"

    	def chart2Map = getChart("node2_svr", server);
    	def piedata2 = chart2Map."pieData"
    	def chart2 = chart2Map."Chart"
    	def jvmInfo2 = chart2Map."MBean"

    	def swing = new groovy.swing.SwingBuilder()

    	def frame = swing.frame(title:'Weblogic INT Memory Usage', defaultCloseOperation:WC.EXIT_ON_CLOSE,
    	                        size:[800,600], locationRelativeTo: null) {
    	    borderLayout()
    	    panel(id:'canvas') { rigidArea(width:700, height:250) }
    	}

    	def bounds1 = new java.awt.Rectangle(0,0, 350,250).bounds
    	def bounds2 = new java.awt.Rectangle(351,0, 350, 250).bounds
    	while(true)
    	{
    	    recalculatePieData(piedata1, jvmInfo1)
    	    recalculatePieData(piedata2, jvmInfo2)

        	chart1.fireChartChanged()
        	chart2.fireChartChanged()

        	frame.pack()
        	frame.show()
        	chart1.draw(swing.canvas.graphics, bounds1)
        	chart2.draw(swing.canvas.graphics, bounds2)
        	sleep(10000)
    	}
    }

    static getChart(nodeName, server)
    {
    	def jvmInfo = new GroovyMBean(server, 'com.bea:Location='+nodeName+',Name='+nodeName+',ServerRuntime='+nodeName+',Type=JVMRuntime')
    	def piedata = new org.jfree.data.general.DefaultPieDataset()
    	piedata.setValue "Free", jvmInfo.HeapFreeCurrent
    	piedata.setValue "Used", jvmInfo.HeapSizeMax - jvmInfo.HeapFreeCurrent
    	def options = [true, true, true]
    	def chart = ChartFactory.createPieChart(nodeName, piedata, *options)
    	chart.backgroundPaint = java.awt.Color.white

        ["MBean":jvmInfo, "pieData":piedata, "Chart":chart]
    }

    static recalculatePieData(piedata, jvmInfo)
    {
    	piedata.setValue "Free", jvmInfo.HeapFreeCurrent
    	piedata.setValue "Used", jvmInfo.HeapSizeMax - jvmInfo.HeapFreeCurrent
    	println piedata.getValue("Free")
    	println piedata.getValue("Used")

    }
}
Blogged with the Flock Browser
2 comments:
Hi i'm a beginner in both java and groovy. really like your groovy demo a lot. i've try to come out with something like this for quit a moment now but with weblogic and soniq MQ broker to show metric in queue ... thank for the exemple especially the jfreechart part .. nice . excuse my english i'm in france ..keep up the good work
Thanks for this example. This is exactly what I'm planning on doing. I have instrumented several java middleware applications and have an XML db server that is already instrumented using JMX MBeans and Agents.
I'm in the process of building a dashboard application that queries the JMX instrumentation and displays various charts and other information.
Your example is very helpful.
Post a Comment